Mean vs Median: Which One Should You Trust?

The mean is your data's arithmetic average, the sum of every value divided by how many values you have. The median is the middle number once you line everything up in order. Use the mean when your data is roughly symmetric and you want every value to count equally. Use the median when a handful of extreme values, like a billionaire's income or a mansion's sale price, would otherwise distort the picture.
- Mean: sum ÷ count. Sensitive to outliers.
- Median: middle value in sorted order. Resistant to outliers.
- Quick rule: skewed or outlier-heavy data → median. Symmetric, clean data → mean.
Median is less affected by outliers and skewed data than the mean, which is exactly why household income gets reported as a median in most government statistics. Keep reading for the formulas, the worked examples, and the visual intuition that makes this stick.
Key Takeaways
The median resists outliers and skew, while the mean uses every value and shifts toward extreme numbers, so the right choice depends entirely on your data's shape.
| Point | Details |
|---|---|
| Mean uses every value | It's the sum divided by count, which makes it sensitive to extreme numbers. |
| Median resists outliers | It's the middle ordered value, unaffected by how extreme the highest or lowest number gets. |
| Skew direction signals which is higher | Right-skewed data pushes mean above median; left-skewed data does the reverse. |
| Report both when shape is unclear | Pairing mean, median, and a spread measure like IQR gives a fuller picture than either alone. |
| Verify calculations with free tools | Metriqahub's math calculators let you check mean and median results without a spreadsheet. |
Table of Contents
- Mean vs Median: The Core Definitions
- How to Calculate Mean vs Median Step by Step
- Why Outliers and Skew Make Mean and Median Diverge
- When to Use Mean or Median in Practice
- Mean, Median, and Mode: When They Agree
- Common Mistakes People Make With Mean and Median
- Try It Yourself: A 60-Second Worked Example
- A Practical Habit Worth Adopting
- Verify Your Numbers With Free Calculators
- Frequently Asked Questions
- Sources
Mean vs Median: The Core Definitions
The mean, often written as x̄ for a sample or μ for an entire population, is the arithmetic average. You add up every value and divide by the count. That "every value" part matters: the mean uses all your data, which is a strength when the data behaves and a weakness when one number goes rogue.
The median is the middle value once your data is sorted from smallest to largest. Half the observations sit above it, half below. It doesn't care how large your biggest value is or how small your smallest one is, only where the midpoint falls.
- Mean (x̄ or μ): sum of all values ÷ number of values. Uses every data point.
- Median: the middle order statistic. Splits ordered data into two equal halves.
- Mode: the most frequently occurring value. Different tool entirely, useful for categorical data or spotting repeated patterns, but it won't tell you much about a dataset where every value is unique.
Mean and median both try to answer "what's typical here?" They just get there by different routes, and those routes diverge hard the moment your data gets lopsided.
How to Calculate Mean vs Median Step by Step
Start with a small dataset: 4, 8, 6, 2, 10.
- Add them up: 4 + 8 + 6 + 2 + 10 = 30.
- Divide by count: 30 ÷ 5 = 6. The mean is 6.
For the median, sort first: 2, 4, 6, 8, 10. With five values (an odd count), the median is the middle one: 6. In this case mean and median match, a sign the data is nicely balanced.
Now try an even-count set: 2, 4, 6, 8. Sort it (already sorted), then average the two middle values: (4 + 6) ÷ 2 = 5. For an odd-numbered set, you pick the single middle value; for an even-numbered set, you average the two middle values — the classic example being that the median of 1 through 9 is 5, while the median of 1 through 8 is the average of the two middle values.
Position-wise, think of it as: for odd n, the median sits at position (n+1)/2. For even n, you average whatever sits at n/2 and n/2+1.
In a spreadsheet, this takes two functions:
=AVERAGE(range)gives you the mean.=MEDIAN(range)gives you the median, and it sorts internally, so you don't need to pre-sort your column.
Pro Tip: If you're pulling MEDIAN across a filtered or dynamically changing range, double-check the function is reading the full dataset, not just the visible rows. Hidden rows can quietly skew results in Excel.
Why Outliers and Skew Make Mean and Median Diverge
Here's where the two measures stop agreeing, and it's the single most useful thing to understand about this whole topic. Take five coworkers earning $50,000, $52,000, $55,000, $58,000, and $60,000. Mean: $55,000. Median: $55,000. Perfectly aligned, because the data is symmetric.
Now the company founder walks in earning $2,000,000. Recalculate the mean: (50,000 + 52,000 + 55,000 + 58,000 + 60,000 + 2,000,000) ÷ 6 = $379,167. The median, though, barely moves: sorted, the middle two values are $55,000 and $58,000, averaging to $56,500. The median shrugged.
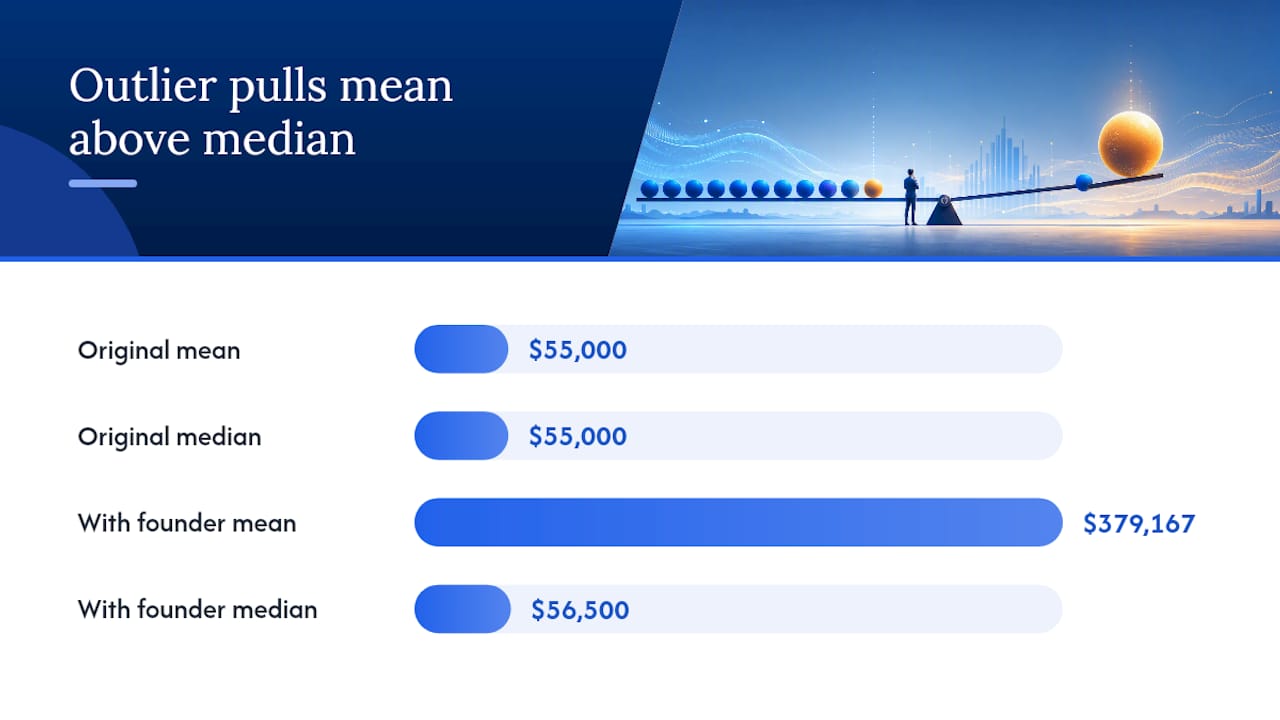
That's the mean acting as a distribution's balance point, shifting toward whichever direction has the extreme values, while the median stays anchored near where most of the data actually lives. This is why economists report median income, not mean income. A small cluster of extremely high earners would make the "average American" look far richer than reality on the ground.
The direction of the pull has a name: skew. In a right-skewed distribution (a long tail stretching toward high values, like income or home prices), the mean sits above the median. In a left-skewed distribution (a long tail toward low values, like scores on an easy exam where most students ace it but a few bombs it), the mean sits below the median. When distributions are skewed, the mean is pulled toward the tail while the median stays closer to the central cluster.
If you plot the data, this becomes obvious fast. A histogram or dotplot with a long tail on one side, and a box plot with a squished box and a stretched whisker, both flag skew visually before you've calculated anything.
- Right-skewed: mean > median (income, home prices, hospital bills).
- Left-skewed: mean < median (exam scores near a ceiling, time-to-failure data).
- Symmetric: mean ≈ median (heights, weights, many natural measurements).
Pro Tip: Calculate both the mean and median for any new dataset before you write a single sentence about it. If they're close, your data is probably well-behaved. If they're far apart, you've got skew or outliers, and you need to say which measure you're using and why.
When to Use Mean or Median in Practice
Run through three questions before picking a summary statistic:
- Is the distribution roughly symmetric? If yes, mean and median will tell nearly the same story, so either works.
- Are there outliers or a long tail? If yes, lean median. It won't get dragged by a handful of extreme values.
- What's the goal of the summary? If you're feeding a value into a formula or model where every data point should count (like calculating a batting average or a machine-learning feature), the mean often makes more sense. If you're describing a "typical" case for a general audience, the median usually communicates reality better.
Where this plays out in practice:
- Household income: median, always. A handful of very high earners would distort the mean upward, painting a rosier picture than most households experience.
- Housing prices: median, for the same reason, one mansion sale can wreck a neighborhood average.
- Test scores: mean, usually, unless a few students score wildly different from the rest.
- Scientific measurements: mean, when instrument error is random and symmetric around a true value.
- Machine-learning features: often mean for normalization, though median is common when the feature has heavy outliers.
When the shape of your data isn't obvious, report both the mean and the median, plus a spread measure like the standard deviation or interquartile range to get better insights with MaxDiff analysis. That combination tells readers more than either number alone ever could.
Mean, Median, and Mode: When They Agree
In a perfectly symmetric distribution, like the classic bell curve, mean, median, and mode all land on the same value. Adult height within a single sex is a decent real-world approximation: most people cluster near the average, with roughly equal numbers taller and shorter.
Skew or multiple peaks break that agreement fast. A dataset with two distinct clusters, say, customer spending that splits into "occasional buyers" and "power users," is multimodal, and no single number, mean, median, or mode, will represent it well. In cases like that, a single central-tendency figure is misleading on its own, and you're better off describing the groups separately or showing the distribution directly.
Common Mistakes People Make With Mean and Median
The most frequent error is using the mean on heavily skewed or outlier-prone data and calling the result "typical." It isn't. A mean income figure inflated by a few billionaires describes nobody's actual paycheck.
Another common trap: treating "average" as a precise term. In casual speech, people use "average" to mean mean, median, or even mode interchangeably, but in a professional report, that ambiguity causes real confusion. Say "mean" or "median" explicitly, don't hide behind "average."
- Using the mean on data with heavy tails or extreme outliers.
- Calling any "average" a fair stand in for "typical" without checking distribution shape.
- Assuming a mean can be calculated for categorical data (it can't, categories aren't numbers).
- Mixing up notation: x̄ denotes a sample mean, μ denotes a population mean. Mislabeling one as the other misleads anyone checking your math.
Pro Tip: Whenever you publish a mean or median, show the sample size and a spread measure (standard deviation or interquartile range) right next to it. A number without context invites misinterpretation.
Try It Yourself: A 60-Second Worked Example
Grab this tiny dataset: 12, 45, 18, 22, 200. Sum them: 297. Divide by 5: the mean is 59.4. Sort them: 12, 18, 22, 45, 200. The middle value, the median, is 22.
Notice the gap. One value, 200, pulled the mean nearly three times higher than the median. That's the outlier effect in miniature, and it's the exact same mechanic playing out in income statistics, housing data, and test scores.
- Type the five numbers into a spreadsheet column.
- Use
=AVERAGE()and=MEDIAN()in adjacent cells. - Compare the two outputs and note how far apart they land.
Pro Tip: If you also want to express the gap as a percentage (how much higher the mean is than the median), a tool like Metriqahub's percentage difference calculator does that math instantly, no spreadsheet required.
A Practical Habit Worth Adopting
The habit that changes how you read data: before writing any conclusion, glance at a histogram, calculate both the mean and the median, and note one spread measure. If the two central-tendency numbers are close, you're safe reporting either. If they're far apart, that gap itself is the story, not a footnote.
Jot down both numbers in your notes, along with a one-line reason for which one you're leading with. It takes ten seconds and saves you from publishing a misleading "average."
Verify Your Numbers With Free Calculators
Running the math by hand builds intuition, but double-checking it takes seconds with the right tool. Metriqahub's finance calculators and math calculators let you compute averages, percentage changes, and related figures instantly, with no registration and no software to install.
If you're comparing incomes, home prices, or survey results and want to see how much a mean shifts once an outlier enters the picture, plug the numbers into the percentage change calculator and watch the shift in real time. It's the same worked-example approach from earlier in this article, just faster, and it's a solid gut check before you commit to reporting one number over the other in a spreadsheet, a report, or a presentation. Try it now with your own dataset to see whether your mean and median tell the same story or a different one.
Frequently Asked Questions
Is mean or median better for analyzing income data? Median is standard for income because a small number of very high earners would pull the mean upward, making typical households look wealthier than they are. What's the difference between mean, median, and mode? Mean is the arithmetic average, median is the middle sorted value, and mode is the most frequent value. They agree in symmetric distributions and diverge in skewed or multimodal ones. When should I use median instead of mean? Use the median whenever your data has outliers or a skewed distribution, home prices, income, hospital bills, anywhere a handful of extreme values could distort the picture. Can the mean and median be the same number? Yes. In a perfectly symmetric distribution, mean and median (and often the mode) land on the same value, which is one signal your data has no meaningful skew. How do you calculate median for an even number of values? Sort the data, then average the two middle values. For 1 through 8, that's (4 + 5) ÷ 2 = 4.5, a number that may not exist anywhere in your original dataset.Sources
- Measures of central tendency | Australian Bureau of Statistics
- Median (measure of central tendency) — Statistics Canada
- Mean vs Median: Knowing the Difference | DataCamp
- Mean, Median, and Mode — Penn State Stat 200